This analysis describes 585 public-school records in the published directory, using the FY2023-2025 assessment window. It measures the coverage and distribution of reported results, not the causal effect of attending a school.
By the AZSchoolRankings.com research project. Calculations generated reproducibly from the released snapshot; narrative prepared with AI assistance. Data snapshot generated 2026-05-05. This is not an official ADE or NCES report.
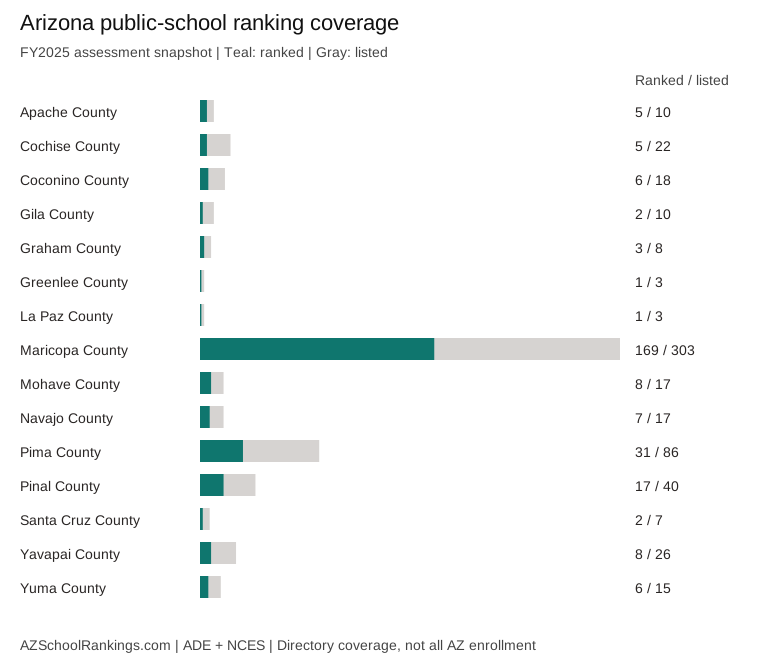
271 of 585 listed schools have an Achievement rank: 46% (271 / 585). The other 314 remain in the directory. They are excluded from statewide rank percentiles, not automatically placed last.
School counts, not student counts. Teal shows ranked schools within each county's gray listed-school total.
Directory coverage by county
County
Listed
Ranked
Unranked
Apache County
10
5
5
Cochise County
22
5
17
Coconino County
18
6
12
Gila County
10
2
8
Graham County
8
3
5
Greenlee County
3
1
2
La Paz County
3
1
2
Maricopa County
303
169
134
Mohave County
17
8
9
Navajo County
17
7
10
Pima County
86
31
55
Pinal County
40
17
23
Santa Cruz County
7
2
5
Yavapai County
26
8
18
Yuma County
15
6
9
Enrollment is available for 584 of 585 directory records. Their combined NCES 2024-25 enrollment is 413,920, including 358,057 at ranked schools. These totals can include lower grades at combined campuses and do not establish the share of all Arizona high-school students covered.
Reported subject proficiency
The median below gives each school with a reportable three-year passing percentage equal weight. It is not the statewide student passing rate. Different subjects can have different reportable-school sets, so comparisons between these medians are descriptive only.
School-level medians and missing-value coverage
Subject
Median passing
Reportable schools
Unavailable schools
ACT ELA
42.5%
320 / 585
265 / 585
ACT mathematics
31.8%
289 / 585
296 / 585
AzSCI science
23.5%
285 / 585
300 / 585
Method: remove null percentages, sort the remaining school values, and use the middle value (or the average of the two middle values). No suppressed cell is assigned zero.
Why records are unranked
29 of 314 unranked records: insufficient scored subjects.
281 of 314 unranked records: no usable assessment components.
4 of 314 unranked records: tested count below minimum.
29 unranked records retain a partial computed score. A partial score does not mean that eligibility requirements were met. These categories describe this export's recorded reason, not every possible underlying cause such as suppression, unmatched records or incomplete reporting.
Completion outcomes and newer enrollment
These separately dated sources add context without changing rankings. Medians give equal weight to schools with exact reported numbers. Protected or bounded cells are excluded, which can materially affect representativeness. For example, excluding protected dropout rates below 2% can raise the median among the remaining exact values; this is not an estimate of Arizona's overall dropout rate. Missing includes protected cells and schools without a matched source row.
Context-source coverage and school-level medians
Measure and period
Exact values
Unavailable
Median
DropoutFY2025 (grades 9-12)
239 / 585
346 / 585
11.86%
EnrollmentOctober 1, 2025 (FY2026; all campus grades)
562 / 585
23 / 585
355 students
Four-year graduationCohort 2025
267 / 585
318 / 585
81.60%
Five-year graduationCohort 2024
273 / 585
312 / 585
82.20%
The four- and five-year rates use different cohorts; they do not show the extra-year improvement for the same students. ADE enrollment includes all campus grades on October 1, 2025 and is not a substitute for the older NCES snapshot or a test-participation denominator.
Verified annual assessment rows are available for 585 profiles. They preserve gaps and are not reconstructed from the three-year summary.
Official A-F grades and open-enrollment participation remain unpublished until their raw files and joins are verified.
What this edition cannot establish
Only 7 policies have dated admissions reviews in this edition. Other classifications are not proof of unrestricted admission. 581 profiles have verified context metrics; availability differs by metric. Annual rows are not reconstructed from three-year averages.
This report does not identify the most improved schools, estimate teaching effectiveness, compare incompatible historical rankings, or treat its directory as a complete census of current programs. Family decisions also require information about course access, support, enrollment and daily logistics.
Sources and reproducibility
The underlying snapshot combines public ADE assessment results and NCES school context under the published methodology. The CSV contains one row per NCES ID. Empty CSV cells are unavailable, not zero; import NCES IDs as text to preserve leading zeros. Partial scores are included with their eligibility reason.
Reproduction: the repository's research generator derives the report JSON, chart and CSV from the same hash-validated snapshot. Reusable project chart: attribute AZSchoolRankings.com, preserve its date and limitations, and link to this report. Original source data remain subject to their publishers' terms.
Download and cite the datasets
Published research edition: 2026-10-02. Derived by AZSchoolRankings.com from public ADE and NCES sources. Each dataset has different periods and coverage. No blanket reuse license for original sources is asserted; consult their terms and the source ledger.
FY2025 Arizona public high school rankings and directory
One row per school in the published directory, with eligibility, statewide Achievement rank, three-year passing summaries and NCES enrollment. Assessments cover FY2023–2025; NCES enrollment uses 2024-25. Unavailable CSV cells are empty, never zero.
Fields include statewide achievement rank, ranking eligibility, act ela passing percentage, act math passing percentage, azsci passing percentage, campus enrollment.
FY2023–2025 Arizona high school annual assessments
Reported school-level annual Grade 11 ACT ELA, ACT math and AzSCI observations for FY2023–2025. Each row identifies the fiscal year, subject and source. Suppressed percentages and unavailable tested counts remain empty, not estimated.
Fields include fiscal year, assessment subject, students tested, passing percentage.
Arizona high school completion and enrollment context: FY2025 research edition
Separately dated school-level graduation, dropout and enrollment context. Each row retains its measure, period, status, source URL and reported bound where applicable. Different graduation cohorts and campus grade spans must not be treated as identical populations. These measures do not affect Achievement rankings.
Need one school or area? Use the JSON and Markdown catalog. Preserve NCES identifiers as strings, and include the source period and canonical profile or report URL in citations.